Mathematics SBA Sample 2 - Using a Survey
Title
How satisfied are students of Royal High School with the lunch services offered by the school canteen?
Introduction
Royal High School has 750 students who mostly use the school canteen for lunch services. The canteen has been serving the staff and students well for many years but students have been becoming increasingly restless with the service that they are getting. Students complain of various issues to do with the food and the time it takes to get served. Other students complain about the attitudes of members of the canteen staff while they are being served.
In order to understand the students problems more clearly a team of student researchers decided to undertake a survey to find out how satisfied the students were with the food and service offered from the canteen.
- How satisfied are students with the food served at the canteen?
- How long on average does it take to be served?
- How satisfied are students with the customer service given?
,Method of data collection
In order to gather information about the issues at hand the researchers decided to use a survey instrument. A total of 100 students were selected, male and female. There are 5 grade levels and 20 students were taken from each grade level. Each student answered a survey consisting of 11 questions. The results of the survey were than organized and presented.
Survey Questions
- Do you buy or consume any form of cooked lunch from the canteen?
- Approximately how long does it take for you to be served your lunch, from your entry into the canteen until you are served?
- How satisfied are you with the length of time it takes to be served?
- How satisfied are you with the cost of the lunch?
- How satisfied are you with the amount of food you get when you compare against the cost
- How satisfied are you with the presentation of the food?
- What specific aspects of the presentation of the food do you think needs improvement? Please state
- How satisfied are you with the taste of the food served?
- What specific aspects of the taste of the food do you think needs improvement? Please state
- How satisfied are you with the level of customer service that you receive?
- What specific aspects of the customer service do you think needs improvement? Please state
Presentation of Data
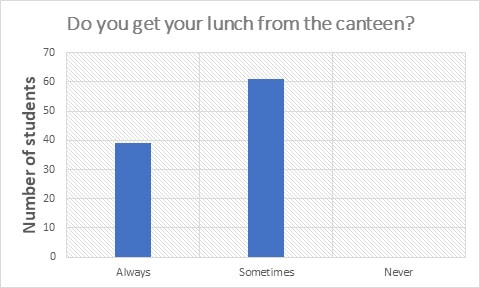
The bar chart below shows the frequency with which students use the canteen's services
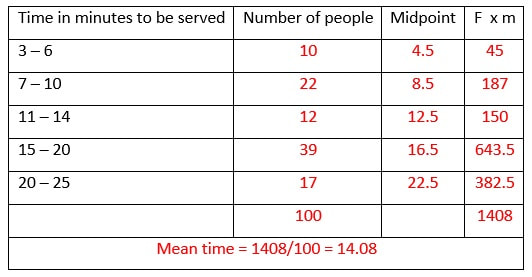
The table below shows the length of time it takes for the students to be served
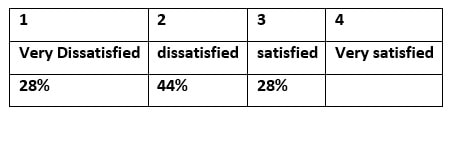
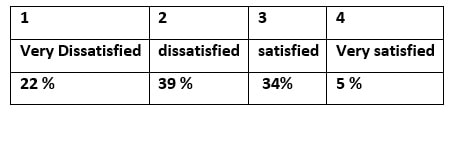
How satisfied are you with the length of time it takes to be served?
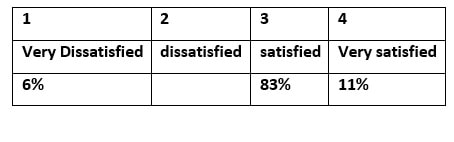
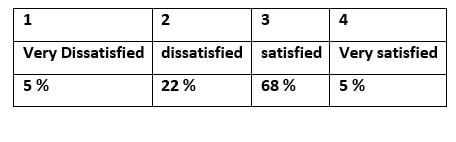
How satisfied are you with the cost of the lunch?
How satisfied are you with the amount of food you get when you compare against the cost
Satisfied are you with the presentation of the food?
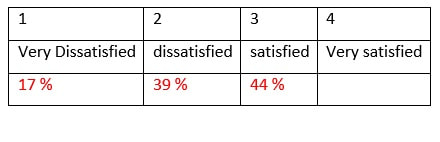
How satisfied are you with the taste of the food served?
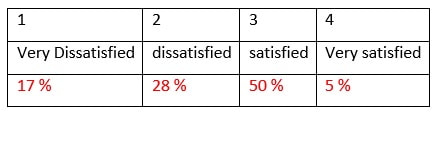
How satisfied are you with the level of customer service that you receive?
Analysis of Data
The survey revealed that 39% of the persons always get their lunch from the canteen while 61% got their lunch from the canteen sometimes. All the persons surveyed were impacted in some way by the canteen. When responding to the time it takes to be served 32% of the persons were served in 10 minutes or less while 68% of the students waited over 10 minutes to be served. The modal interval of time in which students were served was 15 – 20 minutes which had 39%. The mean waiting time was 14 minutes. The data revealed that 72% of the students were either dissatisfied or very dissatisfied with the time they had to wait to be served. Only 28% were satisfied with their waiting time. A total of 97% of the students were satisfied with the price of the lunch. This corresponded with 73% of the students saying they were satisfied with the amount of food they received.
A total of 61% of the students were dissatisfied with the presentation of the food. Their reasons included that the chicken was often over fried or cut too big to fit in the box. Sometimes too much gravy was put on the food causing lunch boxes to leak and cause the rice to look soggy. A total of 56% of the students were dissatisfied with the taste of the food they got. Some of their reasons included that the food was salty or too fresh, tasted burnt or spoiled.
When students were asked about the customer service 45% were dissatisfied and 55% were satisfied. The students mentioned that some staff were kind to them and would accommodate their needs as to what part of the meat they wanted and whether or not they wanted vegetables. Other staff demonstrated a take it or leave it approach.
Students were dissatisfied in three main areas, the length of time it took to be served, the presentation of the food and the taste of the food. The students were satisfied with the cost of the food, the amount of food they got and generally with the customer service. The customer service rating was close however.
Discussion of Findings
The researchers found that the average waiting time to be served was 14 minutes. Most students were dissatisfied with that length of time. The researchers also found that the majority of students were satisfied with both the cost of their lunch and the amount of food that they got. A total of 61% were dissatisfied with the presentation of the food served and 56% were dissatisfied with the taste of the food. Only 45% of the students were dissatisfied with the customer service they got. The students were dissatisfied with three areas, time to be served, taste and presentation while being satisfied with price, amount of food and customer service.
Conclusion
The research team can conclude that students are dissatisfied with the length of time they have to wait to be served, the taste of the food and the presentation of the food. While they are satisfied with the cost, the amount they got and the customer service. It is fair to conclude overall that students generally are not satisfied with their lunches and the services offered by the canteen.