Writing your data analysis for your CSEC SBA
One of the major weakness, so far, to emerge out of the Mathematics SBA project is the inability of students to communicate what their data is saying. The ability to look for patterns in data, to communicate their ideas and to communicate using Mathematical language is wanting.
The following snippets are meant to be samples that students can look at and get ideas of how to write mathematically or how to write up a simple data analysis. This will not just be useful for the Mathematics SBA but for all areas where a discussion of data is required.
The following snippets are meant to be samples that students can look at and get ideas of how to write mathematically or how to write up a simple data analysis. This will not just be useful for the Mathematics SBA but for all areas where a discussion of data is required.
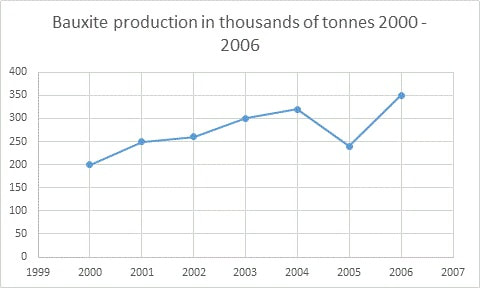
Between 2000 and 2006, 1.98 million tonnes of bauxite was produced with 2006 being the year with the highest production record of 350 thousand tonnes. The production of bauxite has been steadily increasing over the period except in 2005 where there was a decline. There was an average production of 282.9 thousand tonnes per year over the seven year period and a 75% increase in production between the years 2000 and 2006.
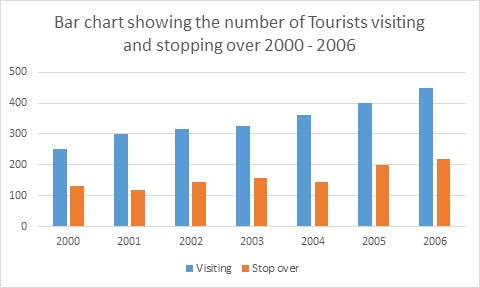
The number of tourists visiting has increased steadily over the years 2000 to 2006 starting with 150 thousand in 2000 and ending with 450 thousand in 2006. The pattern is somewhat similar but slightly different when the number of stop over visitors is examined. The 2001 figures decreased slightly over 2000 but recovered by 2002. The same pattern was observed between 2003 and 2005, the number of stop over visitors has increased steadily however from 2004 to 2006. When both stop over and visitors are compared it is observed that the number of persons stopping over is always 50% or less of those visiting.
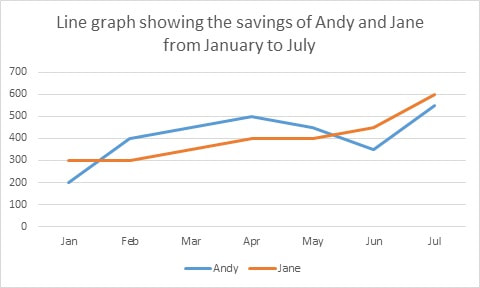
When the savings patterns of Andy and Jane are compared it observed that Jane’s savings increased steadily over the period January to July with the highest rate of savings. Andy’s rate of saving increased from January to April with the highest rate of increase observed between January and February. Andy’s savings decreased between April and June and rebounded in July. In both instances the amount of money saved in July was higher than in January. Jane had a 100% increase while Andy had a 175% increase.
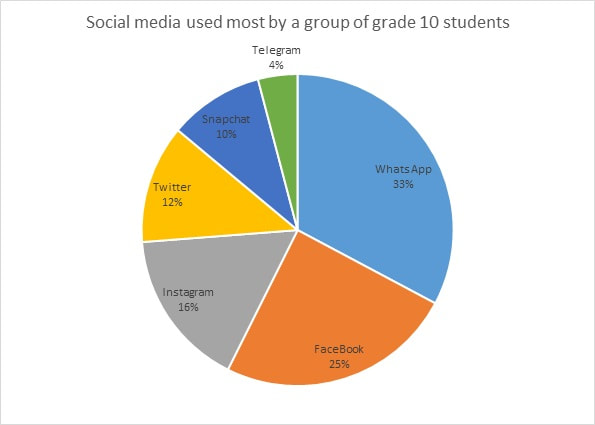
The data shows that almost one third of the students 33% used WhatsApp as their main social media tool while a quarter, 25% used Facebook. Combined Facebook and WhatsApp accounted for 58% of total usage while only 42% of students used other APPS. Instagram was the third most popular with a 16% usage, Twitter had 12% and Snapchat had 10%. The least popular social media type was Telegram which only had a 4% usage.
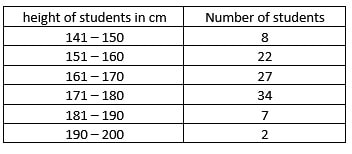
A cursory look at the data shows that of the 100 students measured the majority was in the interval 171 – 180 centimeters. 91% of the student’s height were between 141 and 180 centimeters. Significantly however most were concentrated in the 150 – 180 cm group, 83%. The mean height observed was 163.1 centimeters.