Mathematics SBA Sample 3 - Using an investigation/Experiment
Title
How does the amount of weight carried by an athlete affect their speed over a 50m run?
Introduction
The purpose of this research was to determine if and how the amount of weight carried by an athlete would affect his/her speed over a 50m run. The student researcher had observed that professional athletes always train by dragging weights behind them. Some attach small tyres by string and move up to heavier tyres in progressive resistance training. Athletes do this to build stamina, speed and strength. The student researcher wanted to investigate if there is a relationship between the weight and speed. Information obtain from this SBA investigation could be used by coaches to help train their athletes. This could probably lead to a customizable weight program for each athlete or in general a more scientific way of looking at weight training. The Researcher specifically wants to find out,
- Is there a relationship between the weight and the time taken to run the distance?
- How is the speed impacted by the weight carried?
Method of Data Collection
To carry out this investigation the researcher will ask a classmate to run with weights and while the activity is being done the researcher will take measurements and record the Data in a table. The time will be recorded using the stopwatch on the researcher’s phone. The Physical Education and Sports Department have a variety of weights that they use in their gym. These weights will be borrowed from the department to be used in the experiment/investigation.
The researcher will mark out a 50m distance on the field along the 100m stretch using a measuring tape. The student will run 50m distance without any weights and his time will be recorded to the hundredth of a second. After resting adequately, the student will run with the first weight. The runs will be done over a two-day period. Each time will be recorded. The student will attempt to run as fast as possible each time. The speed will be calculated using the formula S = D/T. This information will also be placed in the table. The data will be modelled using graphing software to look for any patterns or relationship.
The researcher will mark out a 50m distance on the field along the 100m stretch using a measuring tape. The student will run 50m distance without any weights and his time will be recorded to the hundredth of a second. After resting adequately, the student will run with the first weight. The runs will be done over a two-day period. Each time will be recorded. The student will attempt to run as fast as possible each time. The speed will be calculated using the formula S = D/T. This information will also be placed in the table. The data will be modelled using graphing software to look for any patterns or relationship.
Presentation of Data
The table below shows Time taken to run a 50 m distance with the speed calculations included

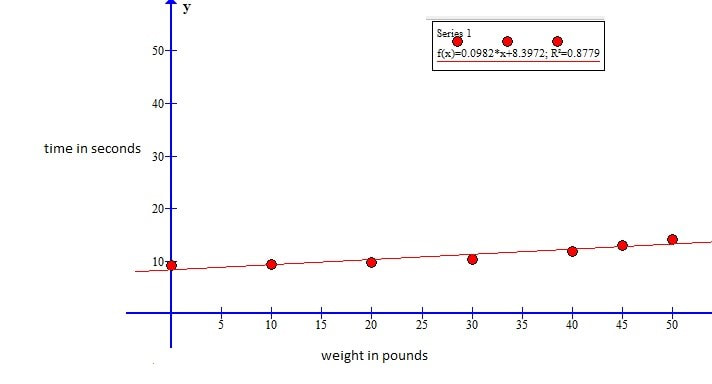
The graph below shows a linear model of the relationship between the weight carried and the time it takes to run the 50m distance
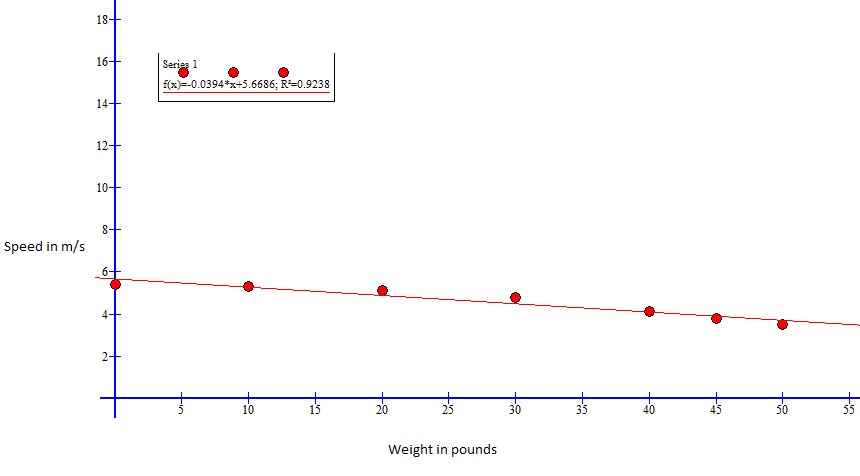
The graph below shows a linear model of the relationship between the weight carried and the speed obtained in each run the 50m distance
Analysis of Data
The data that was recorded during the investigation showed some interesting results. The student ran the 50-meter distance without any weight in a time of 9.15 seconds. This translated to a speed of 5.5m/s. On the second run the athlete carried a 10 pound load and this increased the time slightly to 9.4 seconds with a corresponding decrease in speed at 5.3m/s. when the weight was increased to 20 pounds the time increased to 9.8 seconds with a speed of 5.1m/s. That same pattern continued as the weight increased so di the time and the corresponding fall in the speed achieved. At 30 pounds the athlete ran at 4.8m/s in a time of 10.4 seconds. At 40 pounds his time was 11.97 seconds and his speed was 4.1m/s. Re 45-pound weight carried resulted in a further increase in time.
The student took 12.95 seconds to complete the journey and recorded a speed of 3.9m/s. At 50 pounds the student ran the 50-meter distance in 14.05 seconds with a speed of 3.6m/s.
The data for the weight carried and time taken was modeled using graphing software to search for any patterns in the data. The results were surprising and unexpected. A best fit line was drawn through the data points and revealed a linear function of the form f(x)=0.098x+8.4. The gradient of this function tells us that for every pound added there was an increase in time of approximately 0.1 seconds.
When the weight and the speed were modeled together using the same software a similar linear pattern was observed. This has a best fit line of f(x) = - 0.039x +5.67. This meant that for every pound added the rate of decrease in speed was approximately -0.04 meter per second.
Discussion of Findings
The researcher discovered that there was a linear relationship between the amount of load carried and the time it took to run the 50m distance. The time increased proportionately as the weight increased. The data revealed a linear function of the form f(x)=0.098x+8.4. The gradient of this function tells us that for every pound added there was an increase in time of approximately 0.1 seconds.
There was also a linear relationship between the amount of weight carried and the speed obtained in each run. As the weight increased the student ran the distance progressively slower. The linear model from the graph gave a function f(x) = - 0.039x +5.67. This meant that for every pound added the rate of decrease in speed was approximately -0.04 meter per second.
There was also a linear relationship between the amount of weight carried and the speed obtained in each run. As the weight increased the student ran the distance progressively slower. The linear model from the graph gave a function f(x) = - 0.039x +5.67. This meant that for every pound added the rate of decrease in speed was approximately -0.04 meter per second.
Conclusion
The Researcher had set out to see if there a relationship between the weight and the time taken to run the distance? The Researcher also wanted to find out how the speed of the student is impacted by the weight carried?
The data shows clearly that in each case there is a linear relationship between weight carried and time taken and between weight carried and speed obtained. For every pound added there was an increase in time of approximately 0.1 seconds and for every pound added the rate of decrease in speed was approximately -0.04 meter per second.
The data shows clearly that in each case there is a linear relationship between weight carried and time taken and between weight carried and speed obtained. For every pound added there was an increase in time of approximately 0.1 seconds and for every pound added the rate of decrease in speed was approximately -0.04 meter per second.