CSEC Mathematics Sample SBA
A number of persons have been requesting a sample of a mathematics SBA as a guide.
This SBA is intended to be a sample/Guide and should NOT be copied and submitted as your own work
This SBA is intended to be a sample/Guide and should NOT be copied and submitted as your own work
SBA Title
Does it take longer to run 50m on the curved part of a track than it takes to run the same distance on the straight?
Does it take longer to run 50m on the curved part of a track than it takes to run the same distance on the straight?
Introduction
One of the most exciting events in the field of athletics is the 4x100 meters relay. This event is a team event and much care and strategy goes into choosing the right persons for the right legs. Athletes are chosen based on their ability to run the curve, the straight or their ability to hand off or receive a baton. Some athletes prefer to run the curves while others prefer to run on the straights. This SBA will attempt to discover if it takes longer to run the same distance on the curve or the straight part of the track.
Method of collecting data
The student researcher will ask 20 classmates during PE time to run 50m on the curved part of the track. They will all be using the same lane. Each person’s time will be measured using a stopwatch, rounded to the nearest tenth of a second and the time will be recorded. Those same persons on a separate PE class time will be asked to run 50m on the straight part of the track. The results will be measured in the same way as the distance on the curve and recorded. The two sets of times will then be compared and analyzed.
Presentation of data
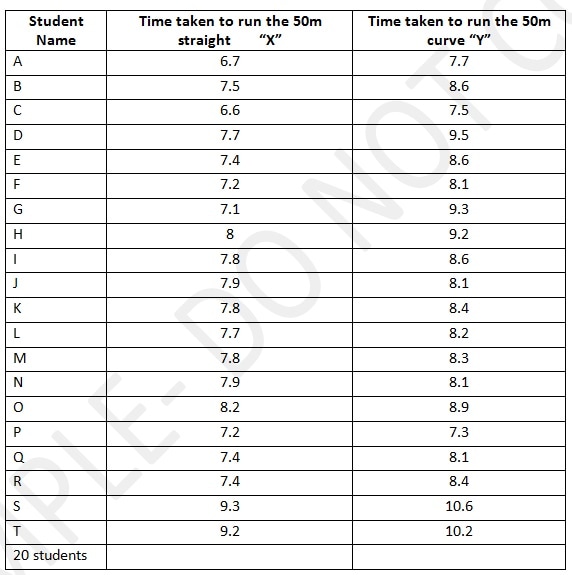
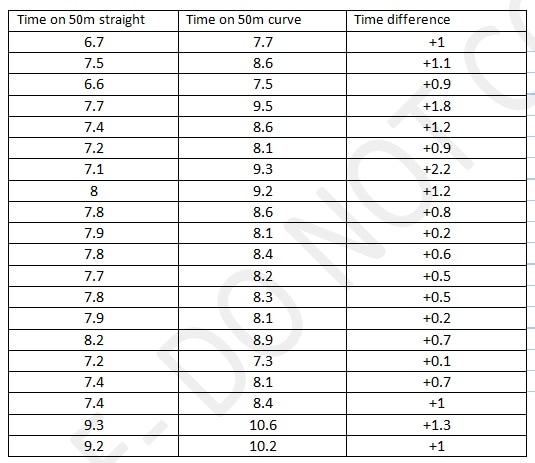
The table below shows the data collected for the times taken to complete the 50m on the curve and on the straight. The students here have been labeled using letters and not their unique names.
The table below shows the data collected for the times taken to complete the 50m on the curve and on the straight. The students here have been labeled using letters and not their unique names.
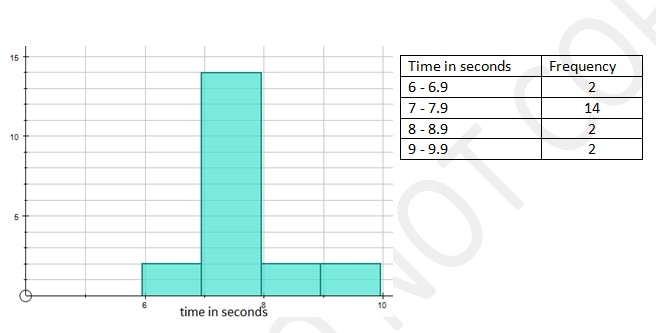
The Histogram below shows the times taken to complete the 50m run on the straight part of the track. The majority of the athletes finished the race within 7 – 8 seconds.
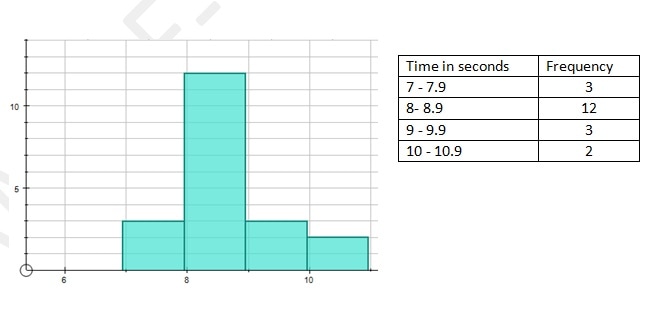
This histogram below shows the times taken for students to finish the 50m on the curve. The Histogram shows that the majority of students finished within 8 – 9 seconds.
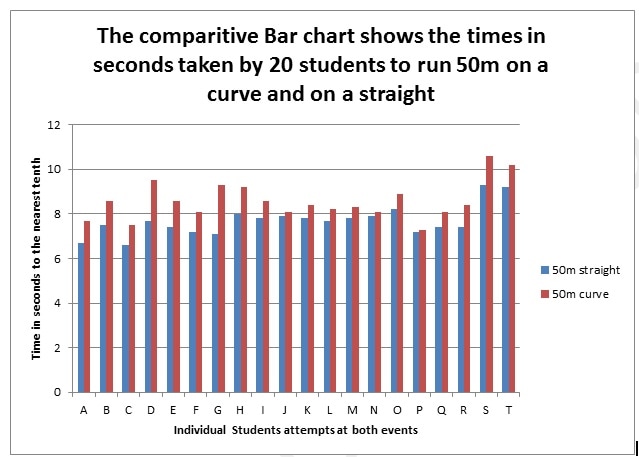
The comparative bar chart below shows the times side by side for each athlete who completed the two events.
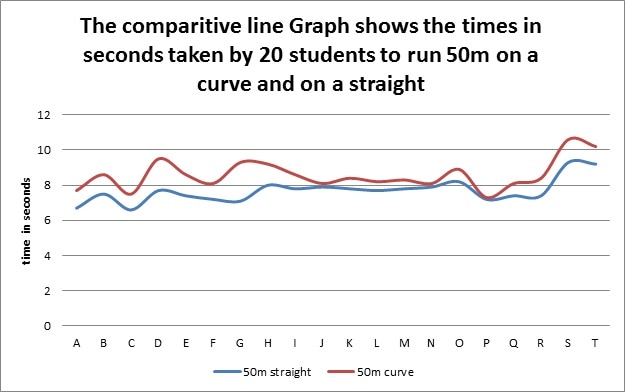
The Line graph below shows the times in seconds it takes to complete both events. It gives a clearer picture of the times taken to complete both events and gives a clearer basis for analysis of the events
Analysis of data
The 50m straight run had a range of 2.7 seconds. This means that it took 2.7 seconds for all the athletes to cross the finish line once the first person had crossed. The 50m run on the curve had a range of 3.3 which is 0.6 which is 3.3 seconds longer than on the straight. The average time taken to run the 50m on the straight is given as 7.69 seconds. The average time taken to complete the 50 run on the curve was calculated as 8.56 seconds. On average it took 0.87 longer to complete the 50m run on the curve than it took to complete the run on the straight. The average speed taken complete the 50m run on the straight was calculated using the formula S+D/T, this showed that the speed on the straight was 6.5m/s compared with 5.8m/s on the curve. The average speed over the 50m straight was faster than on the curve by 0.7m/s.
The table below shows the difference in times taken to complete the two events for each student. The table shows that all athletes had at least a marginal increase in the time taken to complete the events.
Discussion of findings
While it was expected based on the observation of especially 4x100m relays where the curves become very critical, that it would take longer to run the curve than on the straight it needs to be pointed out that in an actual relay the person running the third leg will often run just as fast as the person running the second or anchor leg since those persons do not use a cold start out of the blocks.
The data shows that if both starts are cold, that is if both start out of the blocks, then it takes a longer time to run the 50m around the curve than on the bend. While in some cases there is a very small difference the fact remains that there was a difference.
Conclusion
This SBA started with the assumption that it takes longer to run 50m on the curved part of a track than on the straight assuming that in both cases a cold start is used. The data shows beyond doubt that it does indeed take a longer time to run the curve.
Appendix of Diagrams and Mathematical Knowledge used
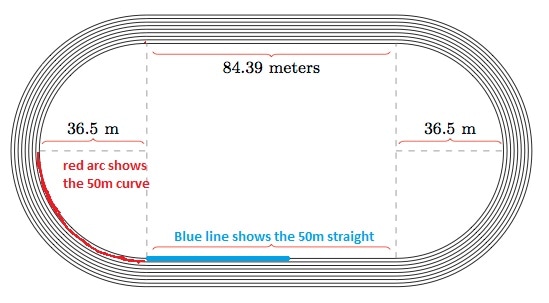
The standard 400m track, the redline shows the approximate 50m on the curve and the blue line shows the approximate 50m straight
The standard 400m track, the redline shows the approximate 50m on the curve and the blue line shows the approximate 50m straight
- Bar Graph
- Line Graph
- Histogram
- Grouped distribution
- Average speed
- Range
- Mean
|
|
|